CSF Building a Metrics Program – Protect Part 3 of 6
Protect should answer: Are the controls we have in place actually reducing the risks we’ve identified? You should be able to see the pattern now that as we move through these parts, that the Cyber Defense Matrix lesson comes into play. We are walking from left to right in a security sense, or from a circle perspective, from the inside out if the center of the circle was the asset we are trying to protect and build walls around; and each wall has controls. Some system and some organizational.
This is 3 of 6 in the series of Building a Metrics Program. Read about Govern and Identify.
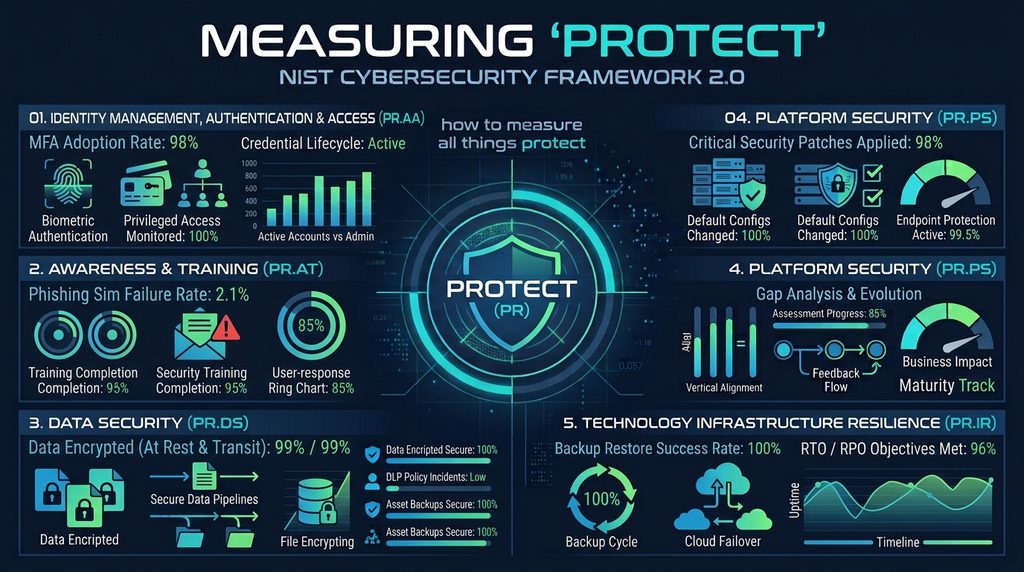
Using NIST CSF 2.0, Protect has five categories:
- PR.AA — Identity Management, Authentication, and Access Control
- PR.AT — Awareness and Training
- PR.DS — Data Security
- PR.PS — Platform Security
- PR.IR — Technology Infrastructure Resilience
The important distinction is that Protect isn’t about how many security controls you have. It’s about whether the controls are appropriately designed, deployed, effective, and reducing risk.
Let’s get started
Protect’s Identity Management, Authentication, and Access Control is knowing if the right people and systems have the right access, for the right reason, for the right amount of time?
| Control / Outcome | Leading indicators | Lagging indicators |
|---|---|---|
| PR.AA-01 Identities and credentials are managed | % identities with authoritative source; orphaned-account detection rate; % accounts with appropriate ownership | Orphaned accounts involved in incidents; compromised accounts |
| PR.AA-02 Identities are proofed and bound to credentials | % identities meeting defined proofing requirements; credential issuance compliance | Fraudulent/incorrect identity provisioning; identity-related incidents |
| PR.AA-03 Users, services and hardware are authenticated | % systems requiring approved authentication; MFA coverage; service-account authentication coverage | Unauthorized authentication events; compromised credentials |
| PR.AA-04 Identity assertions are protected | % authentication mechanisms meeting security requirements; privileged authentication coverage | Credential theft; successful attacks against authentication mechanisms |
| PR.AA-05 Access permissions and authorizations are managed | % access reviews completed; % privileged accounts reviewed; excessive-access findings | Unauthorized access; access-related incidents; toxic combinations discovered |
| PR.AA-06 Physical access is managed according to risk | % critical facilities with appropriate physical access controls; access review completion | Unauthorized physical access; security incidents involving physical access |
This is kind of hard to calculate but knowing the % of critical systems where users or service accounts possess access beyond their documented business requirement is what you should really be about when assessing this area. I know it spans into physical, but that’s where we need to work with facilities to get those answers and let them know, we are more than just 1s and 0s.
Protect’s Awareness and Training let’s us know if our people actually know what they need to do to protect the organization, and can they demonstrate it?
| Control / Outcome | Leading indicators | Lagging indicators |
|---|---|---|
| PR.AT-01 Workforce members receive awareness and training appropriate to their roles | Training completion; role-based training coverage; phishing simulation participation | Policy violations; security incidents attributable to user behavior |
| PR.AT-02 Individuals in specialized roles receive role-appropriate training | % privileged/developer/security personnel completing specialized training; skills coverage | Incidents attributable to skill deficiencies; failed exercises caused by knowledge gaps |
Don’t make the end result about how many people took training, but about how many (the percentage of) are behaving as expected when faced with a simulated threat based off real world stuff.
Protect’s Data Security is a little extension from Identify on knowing where sensitive and business-critical data is, and is it being appropriately handed throughout its lifecycle. You should know where it is, who can access it, how its protected, where does it go, and how long its retained. THEN, what happens when its no longer needed.
| Control / Outcome | Leading indicators | Lagging indicators |
|---|---|---|
| PR.DS-01 Data-at-rest confidentiality, integrity and availability are protected | % sensitive data encrypted; % critical repositories meeting protection requirements | Data exposure due to unencrypted storage; data loss/corruption events |
| PR.DS-02 Data-in-transit confidentiality and integrity are protected | % sensitive data flows using approved encryption; TLS/protocol compliance | Data interception/exposure incidents |
| PR.DS-03 Assets are formally managed throughout removal, transfer and disposition | % retired assets undergoing secure disposal; % transfers using approved methods | Data recovered from disposed assets; unauthorized data transfers |
| PR.DS-04 Adequate capacity is maintained | Capacity monitoring coverage; % critical systems with defined thresholds and forecasting | Capacity-related outages; service degradation |
| PR.DS-05 Protections against data leaks are implemented | DLP coverage; % critical data repositories monitored; data exfiltration detection coverage | Confirmed data leakage/exfiltration events |
| PR.DS-06 Integrity checking mechanisms are used | % critical systems/data repositories with integrity monitoring | Unauthorized modification; integrity-related incidents |
| PR.DS-07 Development and testing environments are separated from production | % applicable systems with environment segregation; exceptions reviewed | Production compromise originating from development/test environments |
| PR.DS-08 Integrity checking mechanisms are used to verify hardware/software | % critical platforms with integrity validation; software integrity verification coverage | Unauthorized software/firmware changes; supply-chain compromise |
Remember, with every metric there is an opposite metric… if you know the % of identified sensitive data at rest or in motion meeting the required access, monitoring and retention, you also know the % of sensitive data that is NOT being handled correctly. What do you need to do about it? You already know this, you figure out some solutions with the business people, the technical people, and price them out and bring it for decisioning.
Protect’s Platform Security is about the technology platforms and knowing they are securely configured, maintained, and controlled.
| Control / Outcome | Leading indicators | Lagging indicators |
|---|---|---|
| PR.PS-01 Configuration management is established and maintained | % critical assets meeting approved configuration baselines; configuration drift monitoring coverage | Security incidents caused by configuration drift; noncompliant systems |
| PR.PS-02 Software is maintained, replaced and removed according to risk | % critical software within supported lifecycle; unsupported software remediation rate | Exploitation of unsupported software; incidents involving obsolete technology |
| PR.PS-03 Hardware is maintained, replaced and removed according to risk | % critical hardware within supported lifecycle; lifecycle compliance | Incidents involving unsupported hardware |
| PR.PS-04 Logs are generated and made available | % critical systems generating required logs; logging coverage; log delivery success rate | Incidents where insufficient logging prevented investigation |
| PR.PS-05 Installation and execution of unauthorized software are prevented | Application control coverage; unauthorized software detection rate | Malware/unauthorized software incidents |
| PR.PS-06 Secure software development practices are integrated | % applications covered by secure SDLC; SAST/SCA/DAST coverage; critical findings remediated before release | Vulnerabilities introduced into production; application security incidents |
You should know what % of critical platforms are meeting the security configurations, where they are in their lifecycle, and what their logging and software requirements are. Where a lot of companies fail is, they don’t have end of life defined, or when they do, they are overallocated with getting the new one set up, that they don’t maintain security configurations or patching or tickets for the old one, introducing risk into the environment.
Protect’s Technology Infrastructure Resilience demonstrates if we can withstand disruption and continue delivering business services.
| Control / Outcome | Leading indicators | Lagging indicators |
|---|---|---|
| PR.IR-01 Networks and environments are protected from unauthorized logical/physical access | % critical environments meeting segmentation requirements; network control coverage | Unauthorized access; lateral movement during incidents |
| PR.IR-02 Technology infrastructure is managed to meet resilience requirements | % critical services meeting availability/resilience requirements; redundancy coverage; resilience testing | Infrastructure outages; failure of redundant systems during incidents |
Simple, do we have a disaster recovery plan? Does it match what the business wants? Is it demonstratable during times of peace? What’s not here is, is there a business resiliency plan and does it work? Is it mapped out?
Here’s what needs to be on the Executive Dashboard
| Metric | Executive question |
|---|---|
| 1. Excessive Access Exposure | Who has access they don’t actually need? |
| 2. Privileged Access Coverage | Are our highest-risk identities appropriately protected? |
| 3. Security Behavior Effectiveness | Are people actually demonstrating secure behavior? |
| 4. Sensitive Data Protection Coverage | Is important data appropriately protected? |
| 5. Data Exposure Risk | Where is sensitive data unnecessarily exposed? |
| 6. Secure Platform Coverage | How much of our critical technology meets security requirements? |
| 7. Vulnerability Risk Reduction | Are controls actually reducing exploitable risk? |
| 8. Security Logging Coverage | Would we have sufficient evidence if something happened? |
| 9. Secure Development Coverage | Are we preventing security defects from reaching production? |
| 10. Critical Service Resilience Coverage | Can critical services withstand disruption? |