CSF Building a Metrics Program – Govern Part 1 of 6
I’m a huge fan of metrics, over the many years I’ve been doing cybersecurity, I’ve been able to prove the progress of my own work to proving the progress of my departments. From individual contributor to leader.
One of the things I really like about the Cybersecurity Framework, is that its short and sweet and easily maps out the left to right defense as it overlays govern, identify, protect, detect, and recover. If you haven’t read my post on the Cyber Defense Matrix, I recommend checking it out so that you can get what I’m talking about, especially in the ‘left to right’ bit.
I know the book is a little dated as CSF 2.0 came out, but from the top view, it adds govern and that’s not a bad area and in my opinion, a good addition. For this one, the leading indicators can be used like a burn-down to get to 100% The lagging indicator, in some cases, is something that might fluctuate monthly and the goal is to keep it at an acceptable percentage, depending on your company’s tolerance.
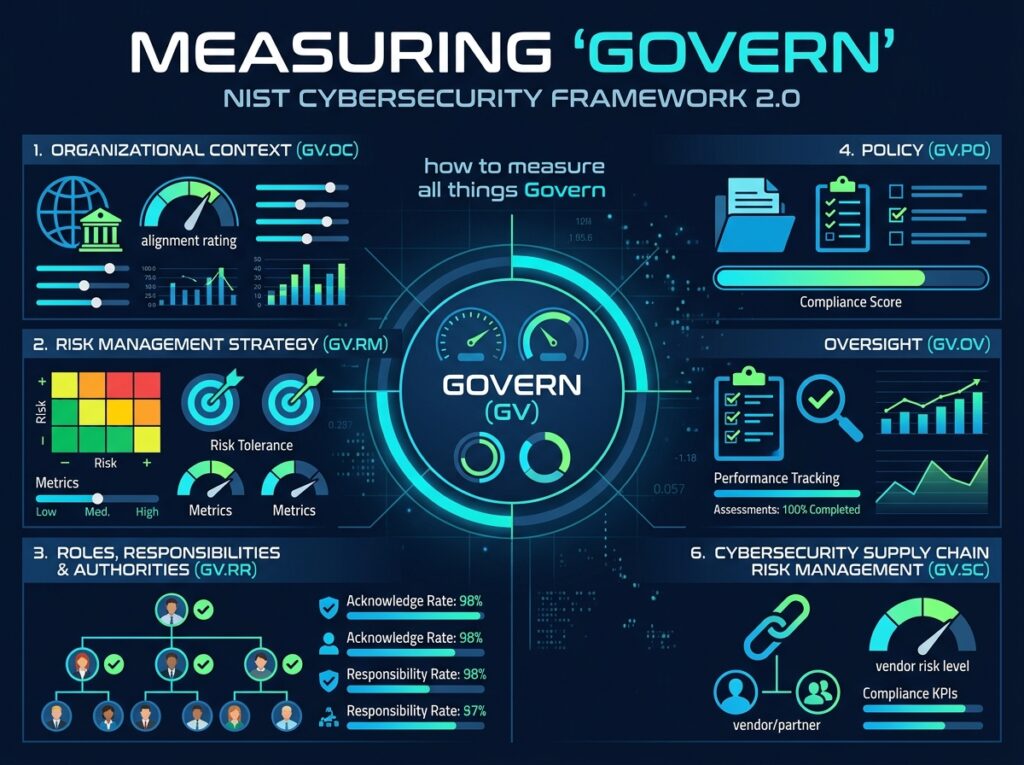
Having been a GRC person, I dig the governance part of it all as well as the rest. Governance is the system of rules, processes, and structures used to direct, control, and hold an organization accountable. It determines who has the authority to make decisions, how policies are set, and how responsibilities are managed. I’m rambling, let’s get to this. CSF 2.0’s Govern has six categories: Organizational Context (GV.OC), Risk Management Strategy (GV.RM), Roles, Responsibilities & Authorities (GV.RR), Policy (GV.PO), Oversight (GV.OV), and Cybersecurity Supply Chain Risk Management (GV.SC).
Govern’s Organizational Context is all about Cybersecurity knowing the business it’s protecting.
| Control / Outcome | Leading indicators | Lagging indicators |
|---|---|---|
| GV.OC-01 Mission is understood and informs cybersecurity risk management | % security objectives mapped to business objectives; % critical business services with security ownership | Security initiatives that cannot demonstrate business alignment; business-impacting security events |
| GV.OC-02 Internal/external stakeholders are understood | % critical stakeholders identified; stakeholder review completion rate | Stakeholder-impact issues discovered during incidents; missed stakeholder requirements |
| GV.OC-03 Legal, regulatory, and contractual requirements are understood | % applicable requirements mapped to controls; % requirements with assigned owners | Regulatory findings; contractual violations; compliance exceptions |
| GV.OC-04 Critical objectives, capabilities and services are communicated | % critical services with documented dependencies/owners | Incidents affecting unidentified critical services; recovery failures caused by unknown dependencies |
| GV.OC-05 Outcomes, dependencies and external relationships are understood | % critical services with dependency maps; % critical third parties mapped to services | Incidents caused by unknown dependencies or third parties |
% of critical business services with a documented business owner, technology owner, security risk owner, and dependency map would be great to capture
Govern’s Risk Management Strategy is about how much cybersecurity risk are you are willing to accept, and how are you making decisions about it.
| Control / Outcome | Leading indicators | Lagging indicators |
|---|---|---|
| GV.RM-01 Risk objectives are established and communicated | % risk objectives with executive/board approval; employee awareness | Decisions inconsistent with established risk appetite |
| GV.RM-02 Risk appetite and tolerance are established | % major risk categories with quantified thresholds | # risks exceeding appetite; duration above tolerance |
| GV.RM-03 Cybersecurity risk is incorporated into enterprise risk management | % cyber risks represented in enterprise risk register; ERM integration rate | Cyber risks discovered outside ERM; duplicate/conflicting risk assessments |
| GV.RM-04 Strategic direction is established | % security roadmap initiatives linked to quantified risks/business objectives | Strategic objectives missed; material risks remaining unaddressed |
| GV.RM-05 Lines of communication for cybersecurity risk exist | % material risks with escalation paths; reporting cadence adherence | Late escalation; risks reaching executives/board without prior visibility |
| GV.RM-06 Risk response options are communicated | % material risks with documented treatment decisions | Unapproved risk acceptance; overdue treatment decisions |
| GV.RM-07 Strategic plans are reviewed | % strategic reviews completed on schedule; % roadmap adjusted based on risk changes | Strategy becoming obsolete; material risks without updated treatment |
From the above, you can go extra and put % of material cyber risks with a quantified exposure, defined risk appetite, named owner, treatment decision, and target date and that would be killer on a CISO dashboard. Learn about CRQ with FAIR.
Govern’s Roles, Responsibilities & Authorities is about mapping out everyone know who is accountable for cybersecurity risk
| Control / Outcome | Leading indicators | Lagging indicators |
|---|---|---|
| GV.RR-01 Leadership establishes cybersecurity responsibility | % critical responsibilities with accountable executive | Accountability gaps discovered during incidents |
| GV.RR-02 Roles and responsibilities are established and communicated | % critical security processes with RACI; % reviewed annually | Tasks missed because ownership was unclear |
| GV.RR-03 Resources are allocated according to risk | % budget mapped to prioritized risks; staffing coverage vs risk requirements | Critical risks unfunded; resource-driven control failures |
| GV.RR-04 Cybersecurity responsibilities are included in workforce roles | % relevant job descriptions with security responsibilities; training completion | Incidents caused by role/accountability failures |
| GV.RR-05 Cybersecurity is integrated into performance/accountability mechanisms | % relevant leaders with cybersecurity objectives | Repeated control failures without accountability |
This could be so very useful when building out a risk management system, like Archer or ServiceNow. Especially useful when populating a CMDB, I know its not specified about assets, but assets should map to their line of business with business owner. % of critical cybersecurity processes with a single accountable owner could be most useful and impressive as that could reveal a constraint or single point of failure.
Govern’s Policy answers the question, does our policy framework establish clear, enforceable expectations
| Control / Outcome | Leading indicators | Lagging indicators |
|---|---|---|
| GV.PO-01 Policy is established based on organizational context and risk | % policies mapped to risks/requirements; policy coverage | Policy gaps identified through audits/incidents |
| GV.PO-02 Policy is communicated and enforced | % workforce acknowledging required policies; exception monitoring | Policy violations; repeat violations |
| GV.PO-03 Policy is reviewed and updated | % policies reviewed within required timeframe | Outdated policies contributing to findings/incidents |
Policy count by itself is useless, its important to capture % of material risks and regulatory requirements covered by current, approved, enforceable policy could be great on a CISO dashboard.
Govern’s Oversight lets cybersecurity leadership know whether their program is actually working
| Control / Outcome | Leading indicators | Lagging indicators |
|---|---|---|
| GV.OV-01 Cybersecurity strategy is reviewed | Executive/board review frequency; % strategic objectives reviewed | Strategic objectives missed |
| GV.OV-02 Cybersecurity performance is reviewed | % KPIs/KRIs reported on schedule; metric coverage | Material deterioration not detected/escalated |
| GV.OV-03 Legal/regulatory requirements are reviewed | Compliance review completion; open finding aging | Regulatory findings; repeat findings |
| GV.OV-04 Performance is evaluated against risk appetite | % KRIs with thresholds; threshold breach response rate | #/duration of risks above appetite |
| GV.OV-05 Cybersecurity outcomes are reviewed | % major initiatives with measured outcomes/ROI | Investments producing no measurable risk reduction |
| GV.OV-06 Risk decisions are reviewed | % material risk acceptances reviewed on schedule | Expired/unreviewed risk acceptances |
While gathering these, it would be great to capture Risk Appetite Breach Rate by Percentage of material cyber risks exceeding approved risk tolerance or Risk Appetite Breach Duration by calculating how long material cyber risks remain above approved tolerance.
Govern’s Supply Chain Risk Management determines we governing the cybersecurity risk introduced by our suppliers and partners.
| Control / Outcome | Leading indicators | Lagging indicators |
|---|---|---|
| GV.SC-01 C-SCRM strategy is established | % critical suppliers covered by C-SCRM program | Supplier-related security incidents |
| GV.SC-02 Roles and responsibilities are established | % critical suppliers with security ownership internally | Supplier issues with no accountable owner |
| GV.SC-03 Supply-chain risk requirements are integrated into contracts | % critical suppliers with required security clauses | Contractual security violations |
| GV.SC-04 Suppliers are prioritized according to risk | % suppliers risk-tiered; % critical suppliers assessed | Critical suppliers operating without appropriate assessment |
| GV.SC-05 Requirements are included in acquisition processes | % new suppliers receiving security review before contracting | Suppliers onboarded without security assessment |
| GV.SC-06 Supplier risks are assessed and monitored | % critical suppliers with current assessments; monitoring coverage | Supplier incidents; overdue remediation |
| GV.SC-07 Supplier risk is included in incident planning | % critical suppliers participating in relevant exercises | Supplier incidents with delayed response |
| GV.SC-08 Suppliers are included in termination/change processes | % terminated suppliers completing security offboarding | Residual access/data exposure after termination |
| GV.SC-09 Supply-chain risk plans are reviewed | % C-SCRM program reviews completed | Repeat supplier risk findings |
The best metric is % of critical suppliers with current risk assessments and verified security requirements.
Now for the deck for the board, this is what you need to have based off everything up top.
| Metric | Indicator |
|---|---|
| 1. Governed Risk Coverage | % material risks with owner, exposure, appetite, treatment & target date |
| 2. Risk Appetite Breach Rate | % material risks exceeding tolerance |
| 3. Risk Appetite Breach Duration | Average days above tolerance |
| 4. Business Service Governance | % critical services with business/security/technology ownership |
| 5. Security Investment Alignment | % security spend mapped to material risks/business objectives |
| 6. Risk Reduction per Dollar | Quantified risk reduction / security investment |
| 7. Accountability Coverage | % critical security processes with accountable owners |
| 8. Policy Effectiveness | % material risks/requirements covered by current enforceable policy |
| 9. Oversight Effectiveness | % material KRIs reviewed/escalated within defined timeframe |
| 10. Critical Supplier Governance | % critical suppliers meeting defined security requirements |
You will want to know how to answer the following about leading and lagging indicators regarding your metrics of Govern.
Leading
Are we doing the things that should reduce risk?
- Risk assessments completed
- Owners assigned
- Policies current
- Suppliers assessed
- Investments aligned
- Reviews occurring
- Risk treatments progressing
Lagging
Did our governance actually produce the desired outcome?
- Risk exposure decreased
- Risks above appetite decreased
- Risk exceptions expired
- Incidents caused by governance failures
- Regulatory findings
- Supplier incidents
- Investments that failed to reduce risk
As with any metrics program, you’ll want the trending that led to current state. Any variances, you’ll want to have answers for spikes. Make sure that the subject matter experts who provide this information to you are competent with their duties and can provide reasoning. That is one of the core lessons from Turn the Ship Around, if you haven’t read it, check out my blog post about it.