CSF Building a Metrics Program – Respond Part 5 of 6
Another program near to me as I took over the SOC. The NIST and the CSF guided me in the ways of incident response… that and my kick-ass team who built the program with me. Without a doubt, since you are on part 5 of 6, I feel you are prepared to read more, but in case you need to jump back, feel free to read about Govern, Identify, Protect, and Detect, of my series, Building a Metrics Program.
Respond is about helping the organization move from once we know something bad happened to controlling the situation and reducing any risk impact… well, keeping it contained if possible.
Using NIST CSF 2.0, Respond has five categories:
- RS.MA — Incident Management
- RS.AN — Incident Analysis
- RS.CO — Incident Response Reporting and Communication
- RS.MI — Incident Mitigation
- RS.IM — Incident Response Improvement
When a negative security event occurs, can we make good decisions quickly to limit its risk impact? Measuring these metrics will help answer that.
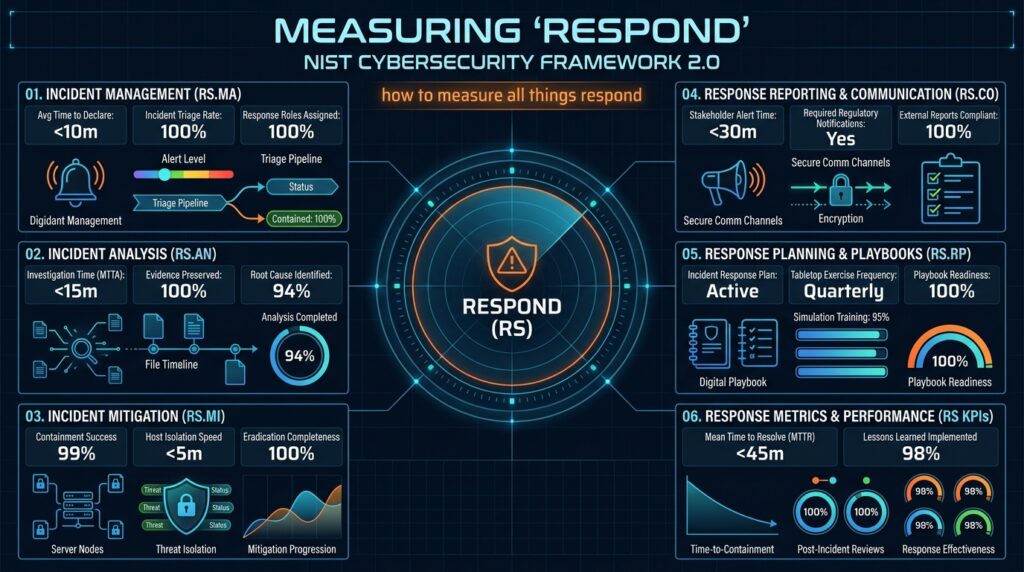
Respond’s Incident Management organizes and manages a cybersecurity incident quickly, establishes ownership, and coordinates the people needed to make decisions on actions that need to be taken.
| Control / Outcome | Leading indicators | Lagging indicators |
|---|---|---|
| RS.MA-01 The incident response plan is executed with relevant third parties once an incident is declared | % material scenarios with tested response plans; exercise completion; third-party participation | Incidents where response plans were unavailable, outdated or ineffective |
| RS.MA-02 Incident reports are triaged and validated | % incidents triaged within SLA; triage accuracy; escalation accuracy | Material incidents initially misclassified or escalated late |
| RS.MA-03 Incidents are categorized and prioritized | % incidents categorized according to defined criteria; prioritization QA | Material incidents assigned incorrect priority; delayed response to high-impact incidents |
| RS.MA-04 Incidents are escalated according to defined criteria | % incidents meeting escalation criteria that are escalated within SLA; escalation-path validation | Late executive/business notification; missed escalation |
| RS.MA-05 Criteria for initiating incident response are established and enforced | % response scenarios with defined activation criteria; exercise validation | Delayed incident declaration; incidents managed informally before formal activation |
Another thing to measure, if you can, is when the alert is received to when the first action was performed.
Respond’s Incident Analysis when what happened was clearly understood, criticality was confirmed, impact was figured out, and next steps are determined.
| Control / Outcome | Leading indicators | Lagging indicators |
|---|---|---|
| RS.AN-01 Investigations establish what happened | % material incidents with documented investigation; investigation SLA adherence | Unknown root cause; incomplete incident understanding |
| RS.AN-02 Actions and events are recorded with integrity | % material incidents with complete timeline; evidence preservation compliance | Inability to reconstruct incident timeline; lost/insufficient evidence |
| RS.AN-03 Analysis is performed to establish what has been affected | % material incidents with documented scope assessment; critical asset/business-service context available | Scope discovered late; affected systems/services underestimated |
| RS.AN-04 Incidents are categorized according to defined criteria | Classification accuracy; incident taxonomy coverage | Incidents reclassified after material impact becomes apparent |
| RS.AN-05 Forensics are performed when appropriate | % applicable incidents receiving forensic analysis; evidence preservation compliance | Root cause remains unknown; forensic evidence unavailable |
| RS.AN-06 Information is provided to authorized personnel and relevant stakeholders | % material incidents with current situation reports; stakeholder notification SLA | Business leaders receive incomplete or delayed information |
| RS.AN-07 Incident estimates and forecasts are updated as new information becomes available | % material incidents with updated impact estimates; forecast update frequency | Significant variance between initial and final impact estimates |
Calculate the time required to establish the affected assets, accounts, data, business services, and third parties associated with the incident. That answers “How big is this!?”
Respond’s Incident Response Reporting & Communication confirms if the right people are getting the right information at the right time so decisions are timely.
| Control / Outcome | Leading indicators | Lagging indicators |
|---|---|---|
| RS.CO-01 Personnel know their roles and responsibilities during incidents | % response roles trained; exercise participation; role acknowledgment | Confusion over ownership during incidents |
| RS.CO-02 Internal and external stakeholders are notified according to response plans | % required notifications completed within SLA; notification accuracy | Late notification; missed notification requirements |
| RS.CO-03 Information is shared according to incident response plans | % material incidents with established communication cadence; situation-report compliance | Stakeholders operating from conflicting information |
| RS.CO-04 Coordination with designated internal and external stakeholders occurs | % material scenarios with identified contacts; exercise participation | Delayed coordination with legal, privacy, regulators, law enforcement, vendors or business leadership |
| RS.CO-05 Incident information is communicated to leadership and decision-makers | % material incidents with executive updates within defined intervals; decision log completeness | Executive decisions delayed by inadequate information |
This isn’t always a metric until the post-mortem if the result was catastrophic, so hand down to your teams how important it is to measure how much data did the incident responder provide for the responsible executive to create an informed decision. It might have to be preceded with inclusion of the right people when creating or testing playbooks.
e.g. When I was in healthcare, before I could make a determination or recommend a determination to cut a B2B connection with a business associate, I needed to know if the connection was providing life saving data or administrative data. Doing the right thing from a cybersecurity perspective might not be doing the right thing from a people endangerment perspective.
Respond’s Incident Mitigation determines that during an incident, we are minimizing potential damage.
| Control / Outcome | Leading indicators | Lagging indicators |
|---|---|---|
| RS.MI-01 Incidents are contained | % material incidents with containment strategy initiated within target; containment SLA adherence | Time from incident declaration to containment; spread of compromise before containment |
| RS.MI-02 Incidents are eradicated | % material incidents with eradication plan; eradication completion rate | Recurrence of compromised systems/accounts; reinfection |
| RS.MI-03 Newly identified vulnerabilities are mitigated or documented | % incident-related vulnerabilities addressed; emergency remediation completion | Re-exploitation of known weaknesses; incidents recurring through same vulnerability |
| RS.MI-04 Incident mitigation activities are validated | % containment/eradication actions validated; post-action testing coverage | Failed containment; attacker persistence after declared containment |
Measure when the incident is announced to when everyone can stand down from the call. Containment has happened and is validated and those responsible for recovery have tickets or duties assigned to them to happen as soon as possible or within a specified time.
Respond’s Incident Response Improvement asks the tough and necessary post-mortem questions.
| Control / Outcome | Leading indicators | Lagging indicators |
|---|---|---|
| RS.IM-01 Response plans incorporate lessons learned | % material incidents producing lessons learned; % response plans updated | Repeat response failures; same response weakness recurring |
| RS.IM-02 Response strategies are updated based on lessons learned | % material findings with assigned corrective actions; corrective-action completion rate | Recurring incidents with same root cause; repeat control failures |
Did the way we work to respond work in our favor? Could anything be improved? Did we delay resolution in any way?
For an executive dashboard, I’d put something like this together.
| Metric | Executive question |
|---|---|
| 1. Incident Activation Time | How quickly do we formally mobilize? |
| 2. Incident Scope Determination Time | How quickly do we understand the size of the problem? |
| 3. Business Impact Assessment Time | How quickly do we know what the event means to the business? |
| 4. Decision-Ready Information Rate | Are decision-makers getting what they need? |
| 5. Executive Escalation Timeliness | Are material events reaching leadership quickly enough? |
| 6. Business Impact Containment Time | How quickly do we stop the damage from growing? |
| 7. Containment Effectiveness | Did containment actually stop attacker activity/spread? |
| 8. Eradication Effectiveness | Did we actually remove the threat? |
| 9. Incident Impact vs. Estimate | How accurate were our initial assumptions? |
| 10. Response Recurrence Rate | Are we actually getting better? |